20251HC4: ECG Monitor

Brief Description & Functionality
An ECG monitor using Arduino is a portable DIY device that detects and displays the electrical activity of the heart. It captures real-time Electrocardiogram (ECG/EKG) signals using biopotential electrodes and visualizes the waveform on a display or sends data to a PC/phone for analysis. This project is perfect for biomedical enthusiasts and learners aiming to understand basic bio-signal acquisition.
It typically uses an ECG analog front-end module like AD8232 to measure the electrical impulses and an Arduino board to process and display data. The device can be used for heart rhythm observation, basic signal monitoring, and educational demonstrations.
🧰 Components Needed
| Component | Purpose |
|---|---|
| Arduino Uno / Nano | Main microcontroller |
| AD8232 ECG Sensor Module | Captures ECG signals |
| Jumper wires | Connections between sensor and Arduino |
| Electrode Pads + Cables | Stick-on electrodes to pick up heart signals |
| OLED Display (e.g., SSD1306) | To visualize waveform (optional) |
| Bluetooth Module (HC-05 or HC-06) | For wireless data transmission to phone (optional) |
| PC / Serial Plotter | For waveform display if no screen is used |
Here are some core components you’ll need to build the fitness watch:
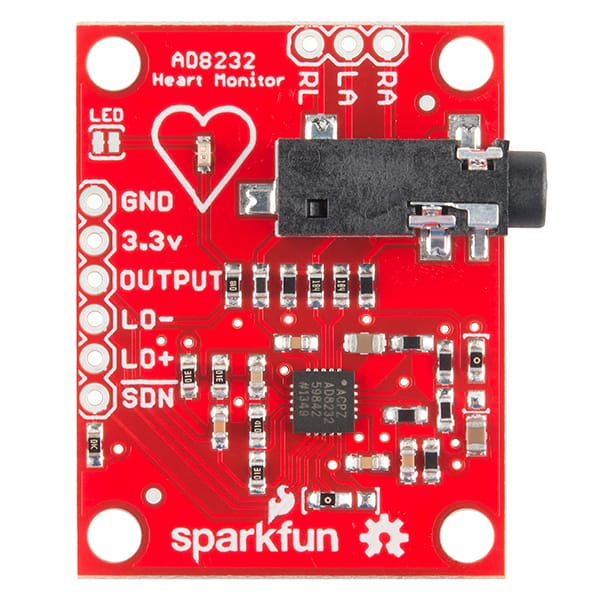
AD8232 module
🛠️ Basic Features
- ECG Signal Capture – Read real-time heart activity via the AD8232 module.
- Waveform Display – Show ECG graph on OLED screen or PC Serial Plotter.
- Heart Beat Detection – Pulse peaks can be highlighted using basic threshold logic.
🫀 What Is an ECG Sensor & the AD8232?
- The AD8232 ECG module captures tiny electrical signals from the heart and outputs them as an analog waveform that represents an electrocardiogram or EKG theorycircuit.com+15Robu+15Robu+15Robu.
- It includes onboard amplifiers and filters to clean up noise caused by body motion or electrical interference Instructables+2Robu+2Robu+2.
- With a single lead setup (three electrodes), it's affordable and widely used for hobby or educational electronics projects Circuit Digest+1Robu+1.
🧩ECG Signal & Medical Relevance
- An ECG trace typically shows a P-wave, QRS complex, and T-wave. These correspond to electrical events in the heart: atrial and ventricular depolarization/repolarization Circuit Schools+1Circuit Digest+1.
- Changes in wave form or timing can indicate cardiac conditions like atrial fibrillation, tachycardia, ST segment deviations, and more Robu.
🖌️Module Features & Pin Details
The module provides nine key pins:
- 3.3 V power input, GND, and OUTPUT (analog ECG voltage).
- Two leads‑off detection pins (LO+, LO–) to signal if electrodes are disconnected.
- A shutdown pin (SDN) to put the module into ultra‑low‑power mode (~200 nA), useful when not in use.
- Three electrode pads: RA (right arm), LA (left arm), and RL (right leg – reference) theorycircuit.com+14Robu+14Circuits DIY+14.
- There’s also an LED indicator that pulses with detected heartbeats Robu+1Robu+1.
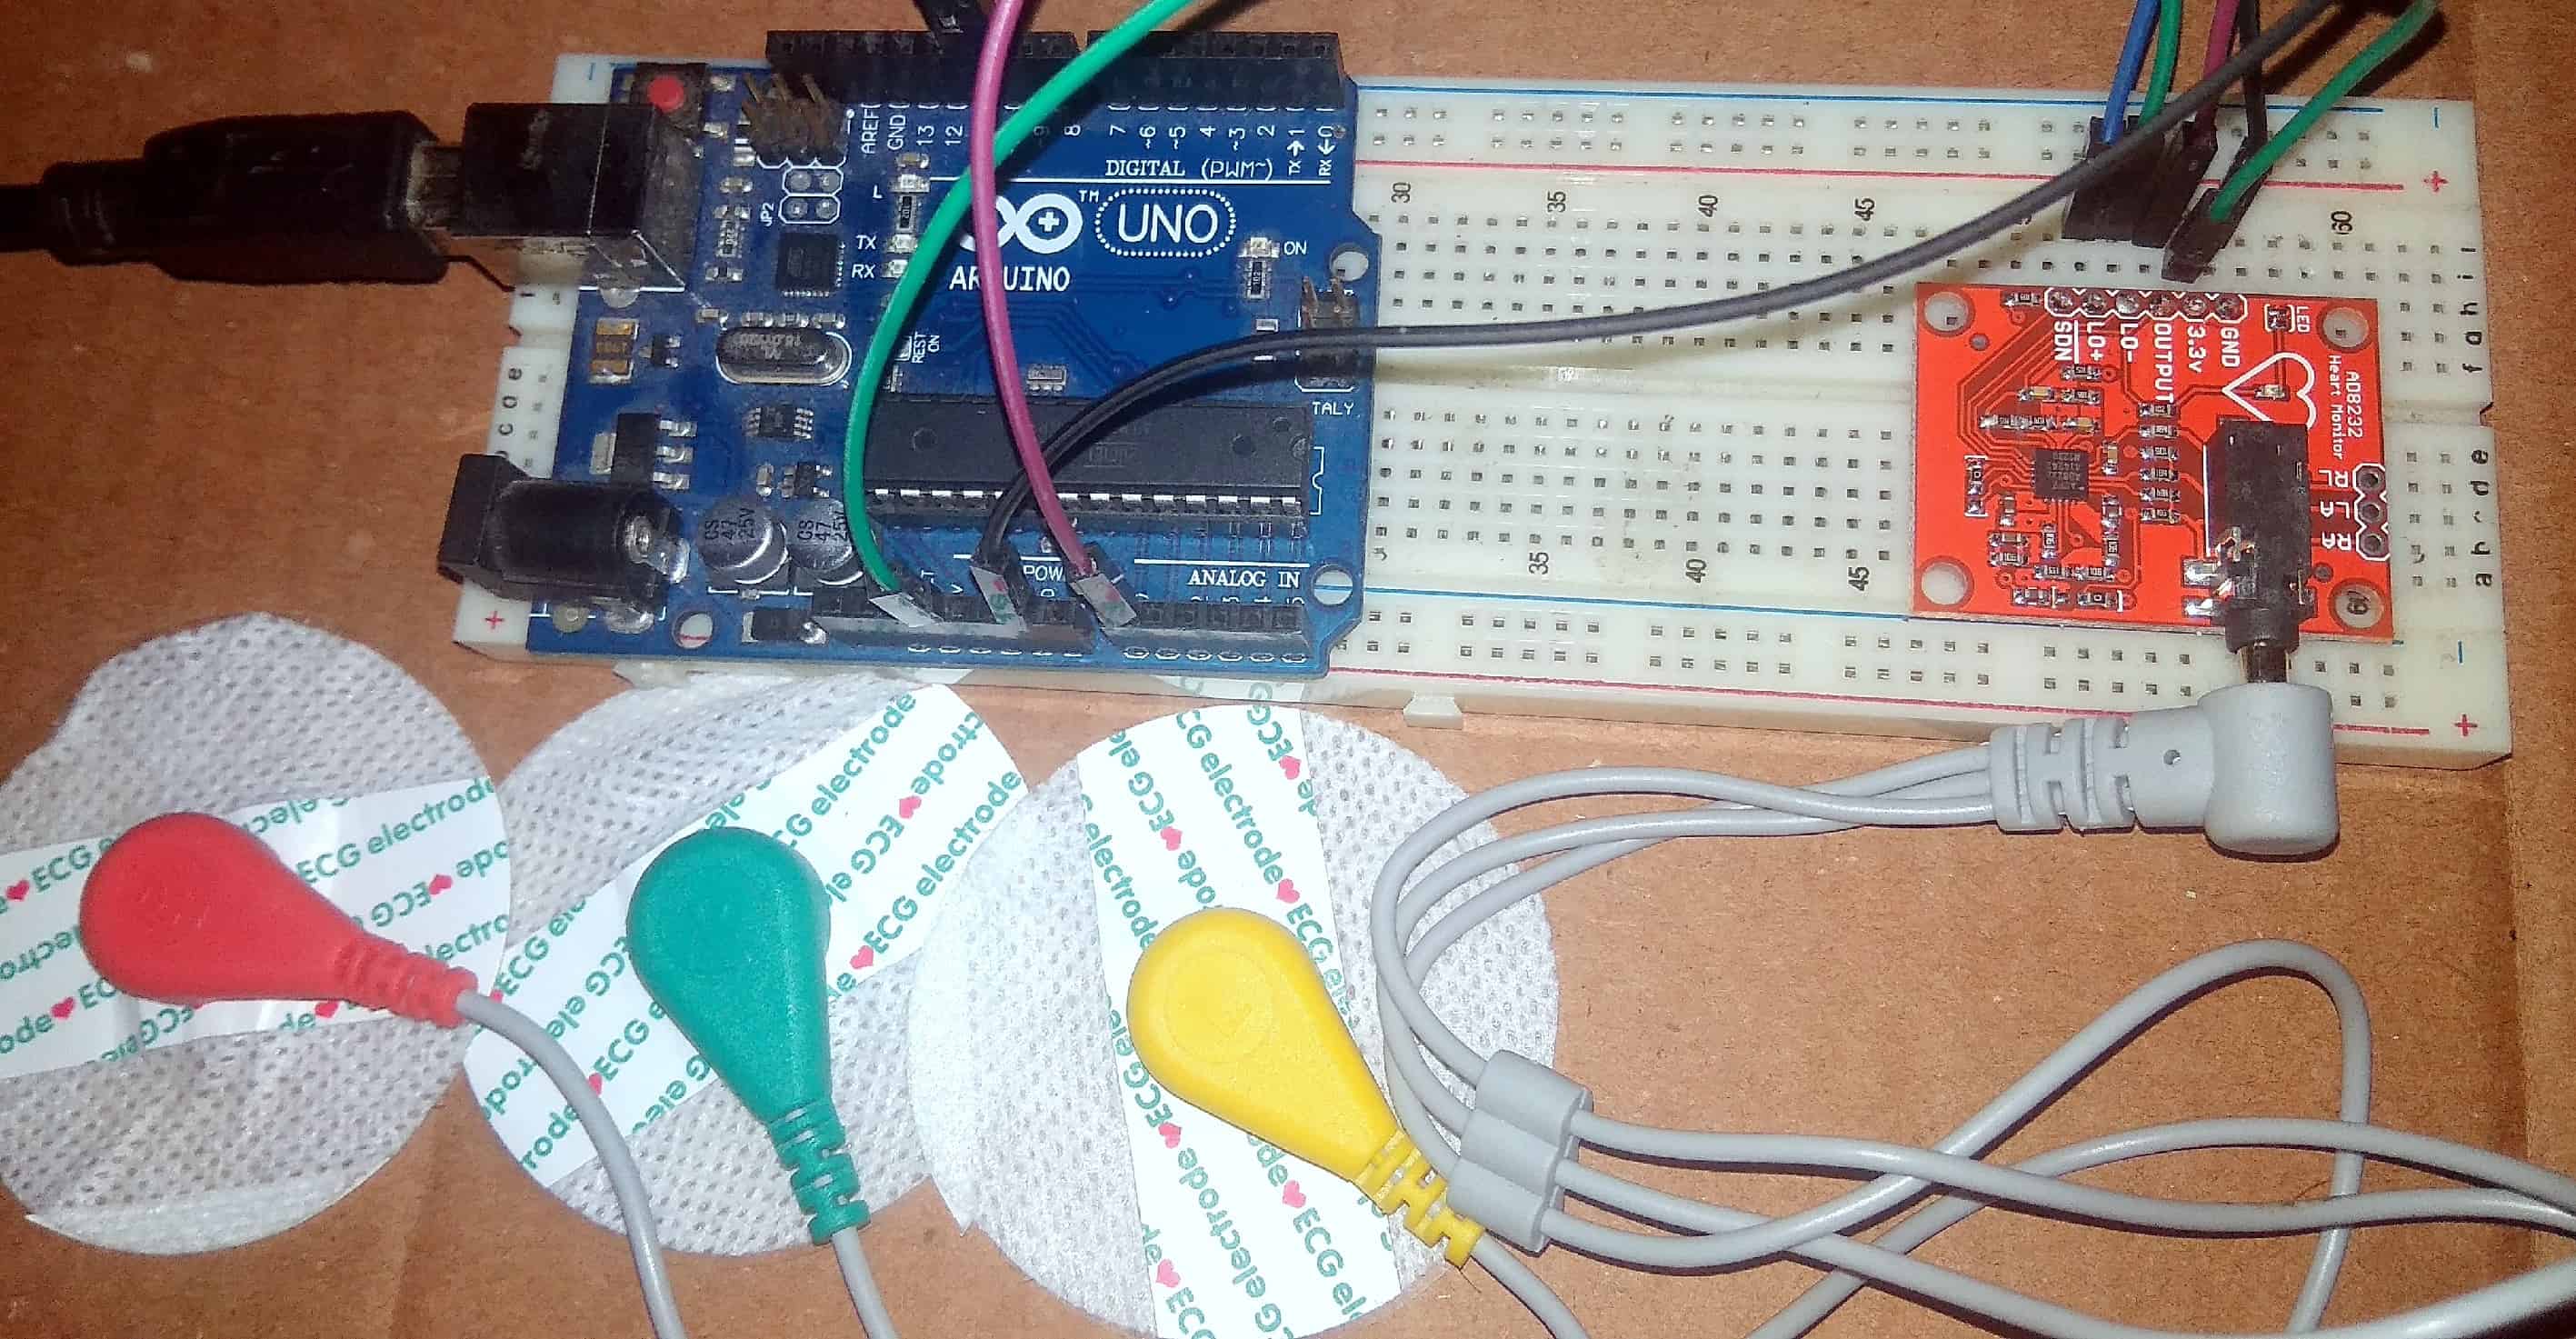
☁️How to Place Electrodes (3‑Lead Setup)
Use RA (red) on the right arm or shoulder, LA (yellow) on the left arm or shoulder, and RL (green) on the right leg or torso. This forms a single‑channel ECG setup. Good contact, close to the heart, improves signal quality RobuRobu.

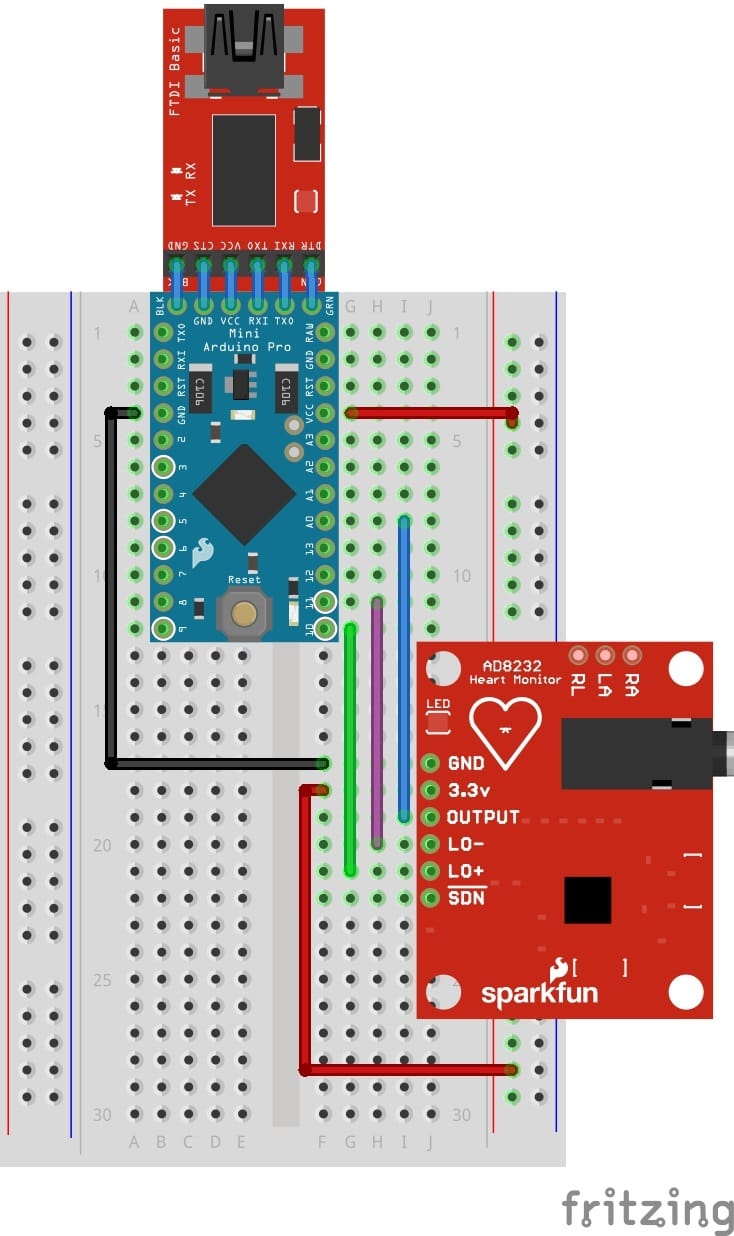
🚀Wiring to Arduino
Typical Arduino connections:
- 3.3 V (sensor) → 3.3 V (Arduino)
- GND → GND
- OUTPUT → Analog pin A0
- LO+ → Digital pin (e.g., D10)
- LO– → Digital pin (e.g., D11)
- SDN may be left floating if low‑power mode isn't used RobuRobu+1Circuit Digest+1Instructables.
🖥️Example Arduino Code
A basic sketch reads the analog ECG value and checks for electrodes going off using LO+ / LO–. It prints "leads off!" if disconnected, otherwise prints the analog reading:
cppCopyEditvoid setup() { Serial.begin(9600); pinMode(10, INPUT); pinMode(11, INPUT);
}void loop() { if (digitalRead(10)==1 || digitalRead(11)==1) { Serial.println("leads off!"); } else { Serial.println(analogRead(A0));
} delay(1);
}
This data can be visualized in the Arduino Serial Plotter or Processing IDE. To derive heart rate or heart‑rate variability, one would detect successive R‑peaks and compute BPM from the interval Circuit DigestCircuit Schools+2Robu+2Circuit Digest+2.
🎥 Learn from Video Tutorials
🧑🔧Skills Required
- Arduino programming (C/C++)
- Circuit simulation
- PCB design
- PCB milling
- Manual soldering
- SMT soldering
- Electronic testing
- CAD modelling
- 3D printing (FDM)